

Daily Data Flow Operations
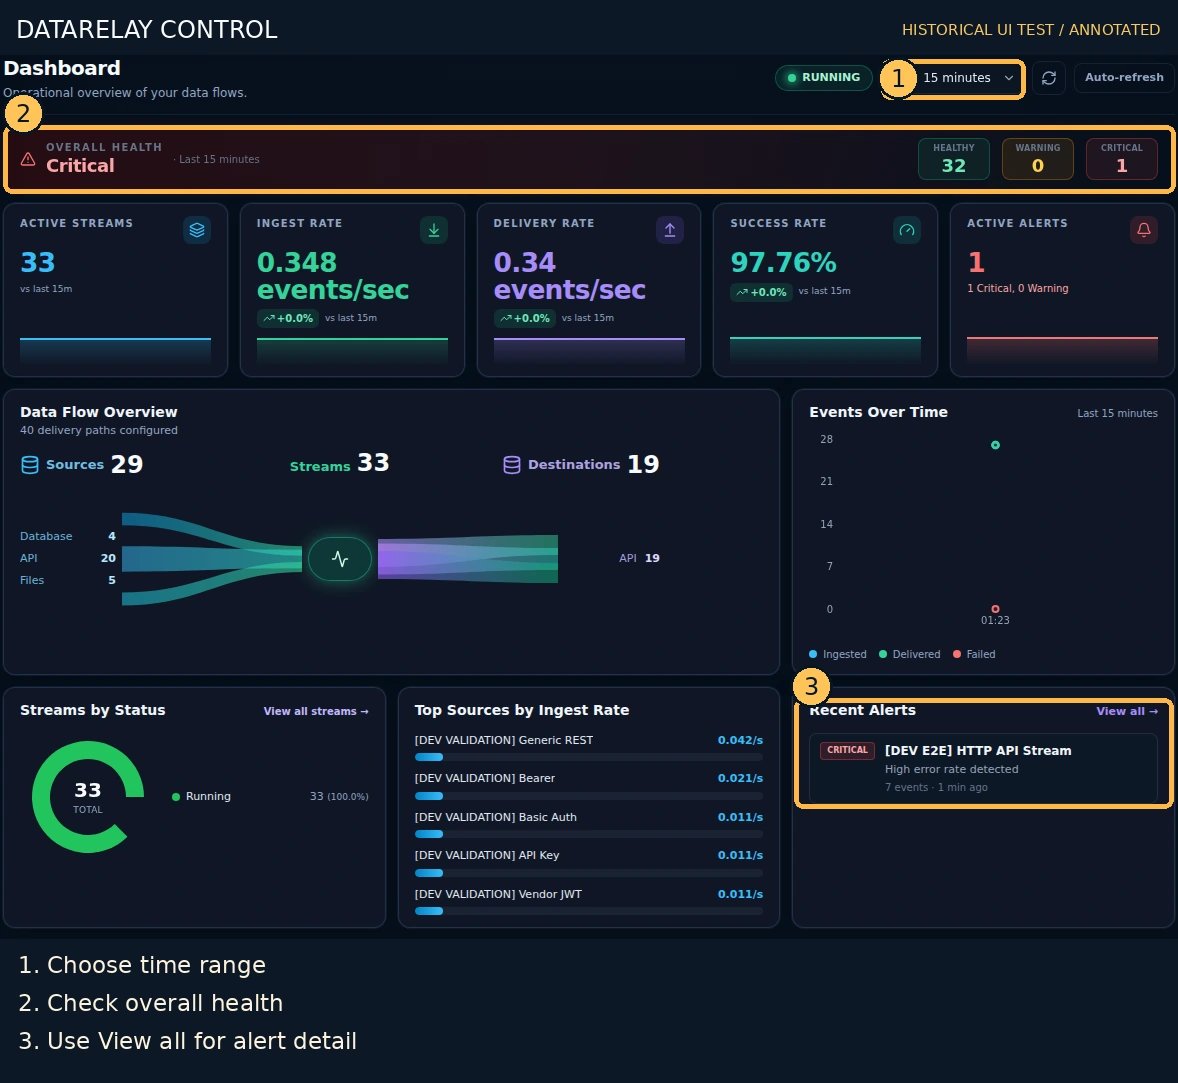
Goal: assess whether critical business data is arriving and being delivered, and identify exactly which Stream/Route requires attention.Screen version: The numbered images are historical Control UI test captures. Follow the current five-step flow (Connect → Sample & Record Selection → Destinations → Route Processing → Deploy), not older step ordering. See the numbered screenshot guide.
When to use this scenario
This scenario builds on an existing Connector, Destination and Stream. If you have not configured a Source yet, start from the connector-specific collection guides. Follow the concrete steps below and verify actual Logs and Destination/quarantine evidence. Existing test screenshots are illustrative, not runtime proof.Before your shift
Know the Stream groups/products you own and the expected incoming event volume/period. Use a Viewer account for observation where possible; edit/Replay actions require authorized roles.1. Review fleet status
- Open Dashboard (
/monitoring). - Record the time window and the overall state: Healthy/Warning/Critical, incoming and outgoing events, and delivery success rate where available.
- Investigate Streams with no data or low volume. Interpret a zero count against the expected source schedule — quiet sources may be normal.
- Examine capacity or schema warning indicators, but do not assume aggregated dashboard indicators prove the cause.
2. Drill down to one affected Stream
- Open Streams (
/streams) and select the relevant product/source group. - Find the Stream with abnormal volume or errors; open its runtime/detail view.
- Confirm Source collection, last run, event extraction, Checkpoint, and current Stream enabled state.
- Open Data Flows / Routes (
/routes) for the Stream; identify whether a specific Route or Destination is degraded.
3. Gather per-Route evidence
- Open Logs (
/logs) and filter by the exact Stream and Route, time window, stage, and status. - Open a failed or suspicious row to record ID, timestamp, cause, and downstream Destination.
- If delivery failed, follow Delivery incident response. If the event was held by policy, follow Quarantine review.
- Save a local search and export loaded matching rows using Logs & exports if formal incident evidence is required.