

Webhook to First Delivered Event
Goal: send one JSON event into Control and verify its arrival at an independent HTTP sink. Requires: lab receiver running on port 9011, a Control Operator/Administrator account, and network reachability from Control to the sink.Screen version: The numbered images are historical Control UI test captures. Follow the current five-step flow (Connect → Sample & Record Selection → Destinations → Route Processing → Deploy), not older step ordering. See the numbered screenshot guide.
End-to-end workflow and acceptance
- Prepare requirements: consult the vendor’s official API/integration guide for endpoint, authentication, least-privilege scope, pagination/checkpoint and sample response. Obtain sanitized test events and actual Destination connectivity information.
- Use ChatGPT for unknowns: supply public documentation and redacted samples; request a checklist of Connector inputs, request parameters, event root, timestamp/ID, cursor and unknowns. Never share secrets. Validate the response with the vendor guide and Run Test.
- Create Connector: Connectors → Create Connector, choose this page’s source type, enter real connection/auth details, save and test connectivity.
- Create Destination: Destinations → Create, choose SYSLOG_UDP/TCP/TLS or WEBHOOK_POST, and configure the actual receiver’s host/port/URL, TLS and authentication.
- Create Stream: Streams → Create → Connect, choose the saved Connector and configure source collection/request settings.
- Confirm samples and schema: Sample & Record Selection → Run Test; verify extracted records, Record Root, Union Schema, pagination and checkpoint.
- Process events: select Destination/Route; configure Mapping, timestamp, enrichment, Masking/Drop/Quarantine in Route Processing. Use Tokenization only if the deployed product supports it. Verify effective Route state and actual output.
- Deploy and prove delivery: resolve readiness findings, start the Stream, and correlate Run ID, Route Logs and the independent Destination receipt. All three are required for PASS.
- Diagnose: for connection/auth check API scope, TLS, network and 429; for zero records check record root/pagination; for failed delivery follow Delivery Incident; for changed fields follow Schema Drift.
Suggested ChatGPT prompt
I want to collect this vendor’s logs using DataRelay Control. Based only on the public API guide and redacted JSON sample below, list required Connector connection/auth fields, API request/pagination, event root, timestamp/ID/checkpoint, mapping and sensitive-field protection, and failure diagnostics. Mark undocumented information ‘needs confirmation’ rather than inventing values.
1. Create the Destination
- Open Destinations (
/destinations) and select the create/new action. - Enter Name =
Lab Webhook Sinkand Type =WEBHOOK_POST. - Set URL =
http://REACHABLE-TEST-HOST:9011/sink, replacing the placeholder with the address reachable from Control’s network. - Set Webhook Payload Mode = Single Event Object (
SINGLE_EVENT_OBJECT). - Save. If a connection/test action is available, run it; inspect and resolve any failure. A saved Destination is not yet proof of delivery.
2. Create a Webhook Receiver Connector
- Open Connectors (
/connectors), choose Add/Create Connector, and select Webhook Receiver. - Set Connector Name =
Lab Webhook Source. - In Webhook Receiver, select Auth mode = No auth only in this isolated lab. For real senders use Shared secret header or Bearer token and provide the corresponding secret outside the documentation.
- Paste the synthetic JSON sample into Payload preview.
- Save. Return to the Connector detail and copy the generated Receiver URL. It ends in
/api/v1/ingest/webhook/{receiver_key}. Do not invent or reuse an arbitrary receiver key.
Opening the Receiver URL in a browser performs a GET request, not a JSON ingest. An actual ingest is HTTP POST with JSON or NDJSON. If the Connector offers Copy URL, use that value.
3. Create the Stream and Route
- Open Streams → Create or navigate to
/streams/new. - Connect: select
Lab Webhook Source; confirm the source configuration. - Sample & Record Selection: inspect Run Test and Record Selection. Confirm a sample event, the event root/record path, and the extraction result. Use the configured payload preview or send a lab event if no records are available; do not claim success when zero records are selected.
- Destinations: choose
Lab Webhook Sink(or the previously saved Destination). Control associates a Route with it. - Route Processing: use inherited/default processing for this initial test; check Route Processing Preview and unresolved validation warnings. Mapping preview alone is not delivery proof.
- Deploy: verify readiness; save/deploy and explicitly start/enable the Stream if the resulting state requires it.
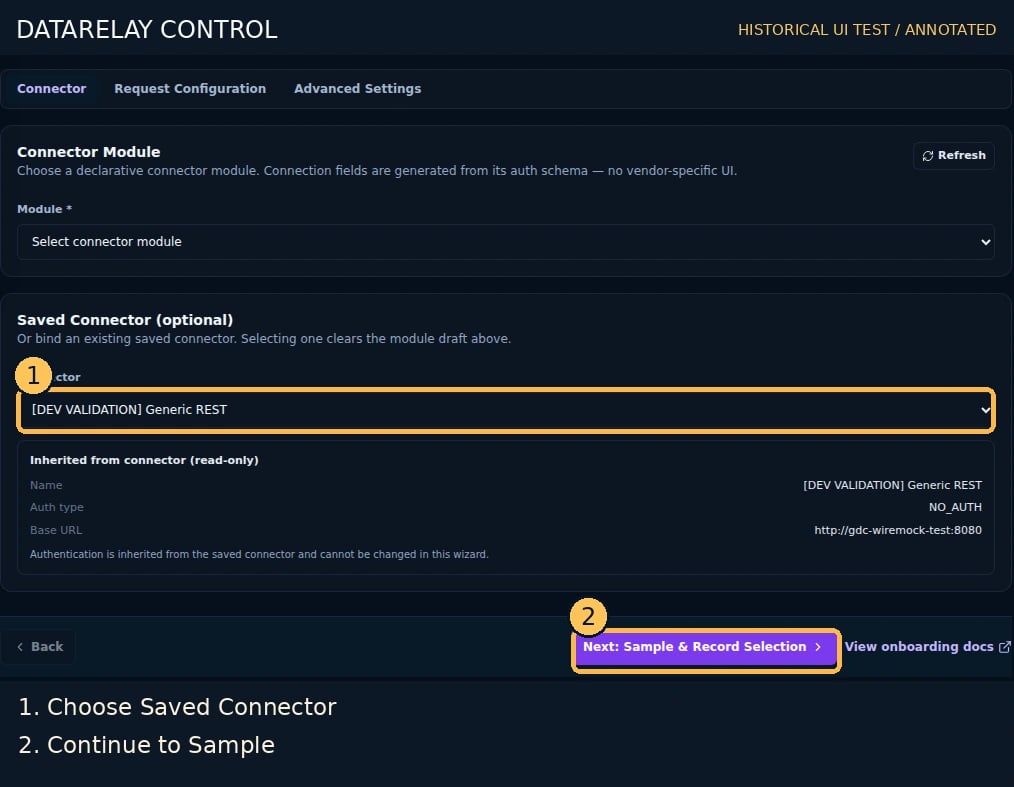
4. Send one event into Control
Copy the generated Receiver URL in the Connector UI and assign it locally, then send:5. Confirm end-to-end delivery
- Check Streams for an enabled/running Stream and a recent execution.
- Open Data Flows / Routes (
/routes) and inspect the Route and Destination state. - Open Logs (
/logs), filter by the relevant Stream, Route, and status; find a successful delivery for the new event. - On the independent receiver host, run
tail -n 3 received-9011.ndjson. Confirmcontrol-lab-001in the payload. Compare its fields to the sample.
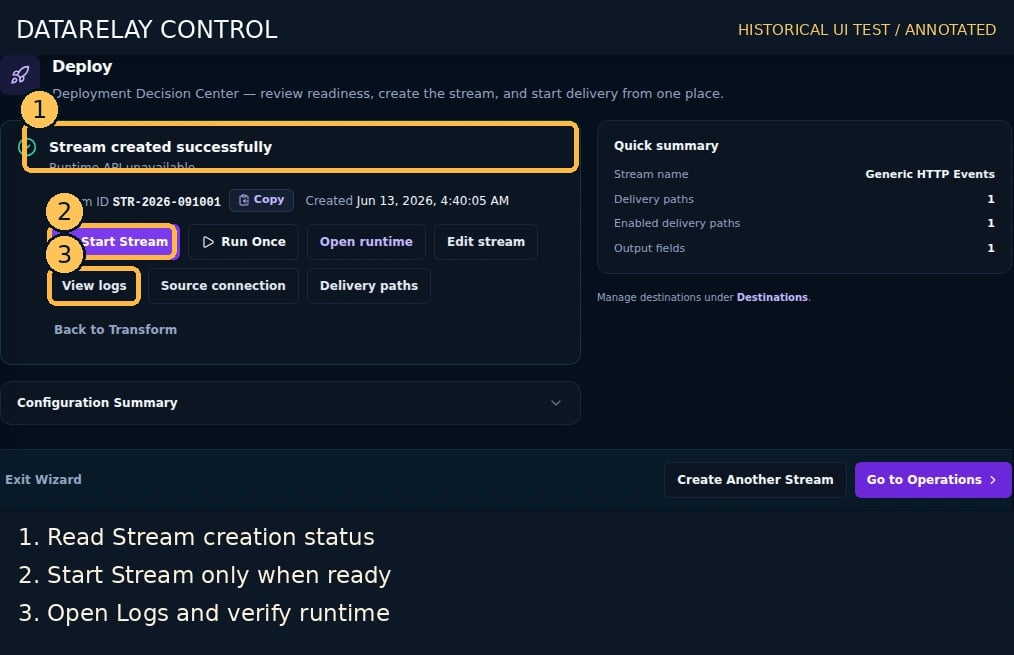
If it fails
- No Receiver URL: save the Connector and reopen details; do not guess the key.
- 401/403 on POST: check the selected webhook authentication mode and header.
- No sample / no event root: return to Sample & Record Selection and confirm records, not just JSON preview.
- Receiver has no event: verify the sink’s reachable IP (especially across Docker), URL, Route enabled state, and Logs.
- HTTP 409
RUN_ALREADY_ACTIVE: another run overlaps; inspect runtime status and retry only after resolving the overlap without creating duplicate events.