

Find, Save, and Export Delivery Evidence
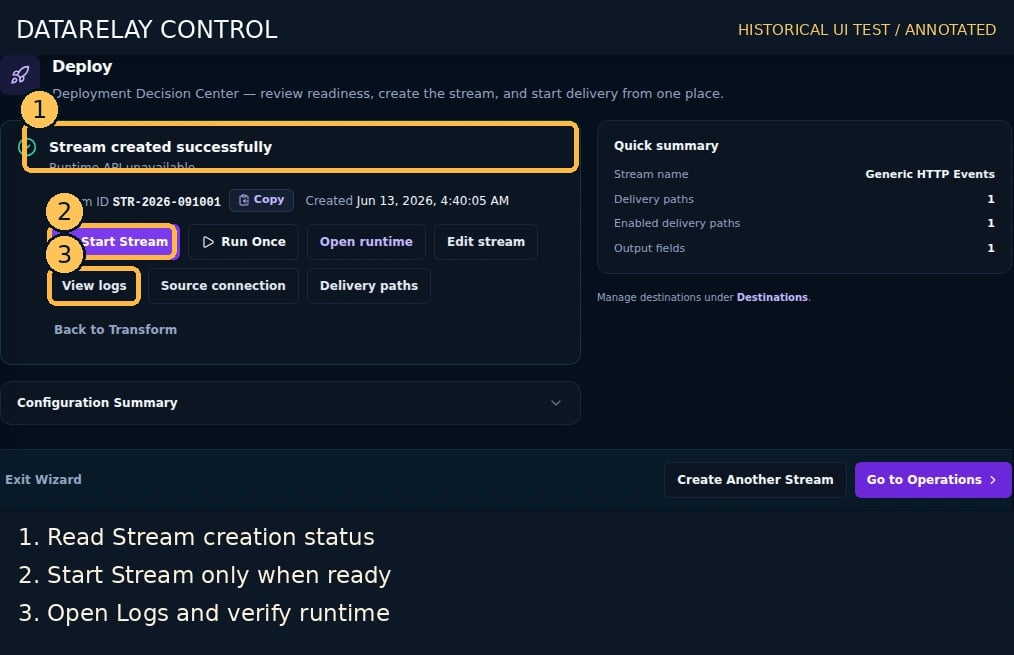
Goal: prepare a reproducible evidence set for a delivery incident without confusing aggregate charts with a specific event’s outcome.Screen version: The numbered images are historical Control UI test captures. Follow the current five-step flow (Connect → Sample & Record Selection → Destinations → Route Processing → Deploy), not older step ordering. See the numbered screenshot guide.
When to use this scenario
This scenario builds on an existing Connector, Destination and Stream. If you have not configured a Source yet, start from the connector-specific collection guides. Follow the concrete steps below and verify actual Logs and Destination/quarantine evidence. Existing test screenshots are illustrative, not runtime proof.1. Open and scope Logs
- Open Logs (
/logs). - Choose a time range including the test. Filter by Stream and Route. Use status/level/stage filters to narrow the result.
- Find the relevant delivery row. Open its details to inspect the result, stage, timestamp, route, and any available run/error context.
- If you arrive from a Route or Destination detail via a deep link, verify the Stream/Route filters actually match your intended investigation.
2. Save a reusable view
- With the desired filters selected, open the Saved searches menu.
- Save the current filter snapshot under a descriptive name, for example
lab-route-503-20261018. - Reopen the Saved menu and select your saved view. Confirm the displayed filters and rows are correct.
At the audited implementation the saved-search snapshots use browser localStorage (
gdc.logs.savedSearches.v1). They are not server-shared audit records, and clearing browser storage can remove them. Preserve a separate evidence export for retention.3. Download loaded matching rows
- Use the Download menu.
- Select Download JSON (loaded matching rows) or Download CSV (loaded matching rows).
- Open the resulting file locally; confirm the event/run/route identifiers match the on-screen filtered rows.
- Record who performed the export, when, the filter criteria, and the file checksum if the evidence enters a formal investigation.
4. Correlate with a receiver and Governance
- For a successful Webhook delivery, compare the Route delivery row with
received-9011.ndjson. - For failures, compare error code and run ID with the controlled receiver condition.
- For protected/quarantined events, check the Governance record separately; avoid using a missing Destination receipt as sole proof of Quarantine.
Completion check
PASS = exact scoped filters, opened row details, a saved local view, a CSV/JSON file with matching identifiers, and independently corroborated delivery or held status.If it fails
- Saved view is missing: ensure the same browser profile and unchanged local storage.
- CSV or JSON is empty: check current filters and rows loaded in the UI before exporting.
- A URL with
route_idpoints to wrong/empty data: verify the numeric ID and adjust the filters manually; do not use a display-name match as proof of identity. - An old log URL shows 404: open
/logsand reapply the known Stream/Route filters.